How Acquisition, UX, and CRO Turn Traffic Into Opportunities Across the Conversion Funnel
Digital Growth

Your page loads fast, the design is flawless, and navigation has no bottlenecks, yet sales opportunities still refuse to show up. This scenario is more common than it seems, and it almost always points to the same diagnosis: a broken promise before the click.
When the promise made in an ad, a search result, or an AI-generated answer does not match what the page actually delivers, the result is wasted budget on unqualified traffic. At the same time, high-intent visitors who do not find a solid value proposition when they arrive at the site create what is known as navigation churn.
To pinpoint exactly where the leak is happening, whether in attraction, qualification, or conversion friction, you need to analyze the pipeline end to end. This integrated view is where disciplines like SEO, GEO, AEO, UX, and CRO come together and generate strategic value.
In this article, you will gain a thorough understanding of how the conversion funnel works, how to unblock bottlenecks at each stage, and which practical strategies to apply to turn your traffic into real sales opportunities.
Does your site get visits but few turn into opportunities?
Connect acquisition, experience, and conversion in a data-driven strategy.
What Defines the Conversion Funnel?
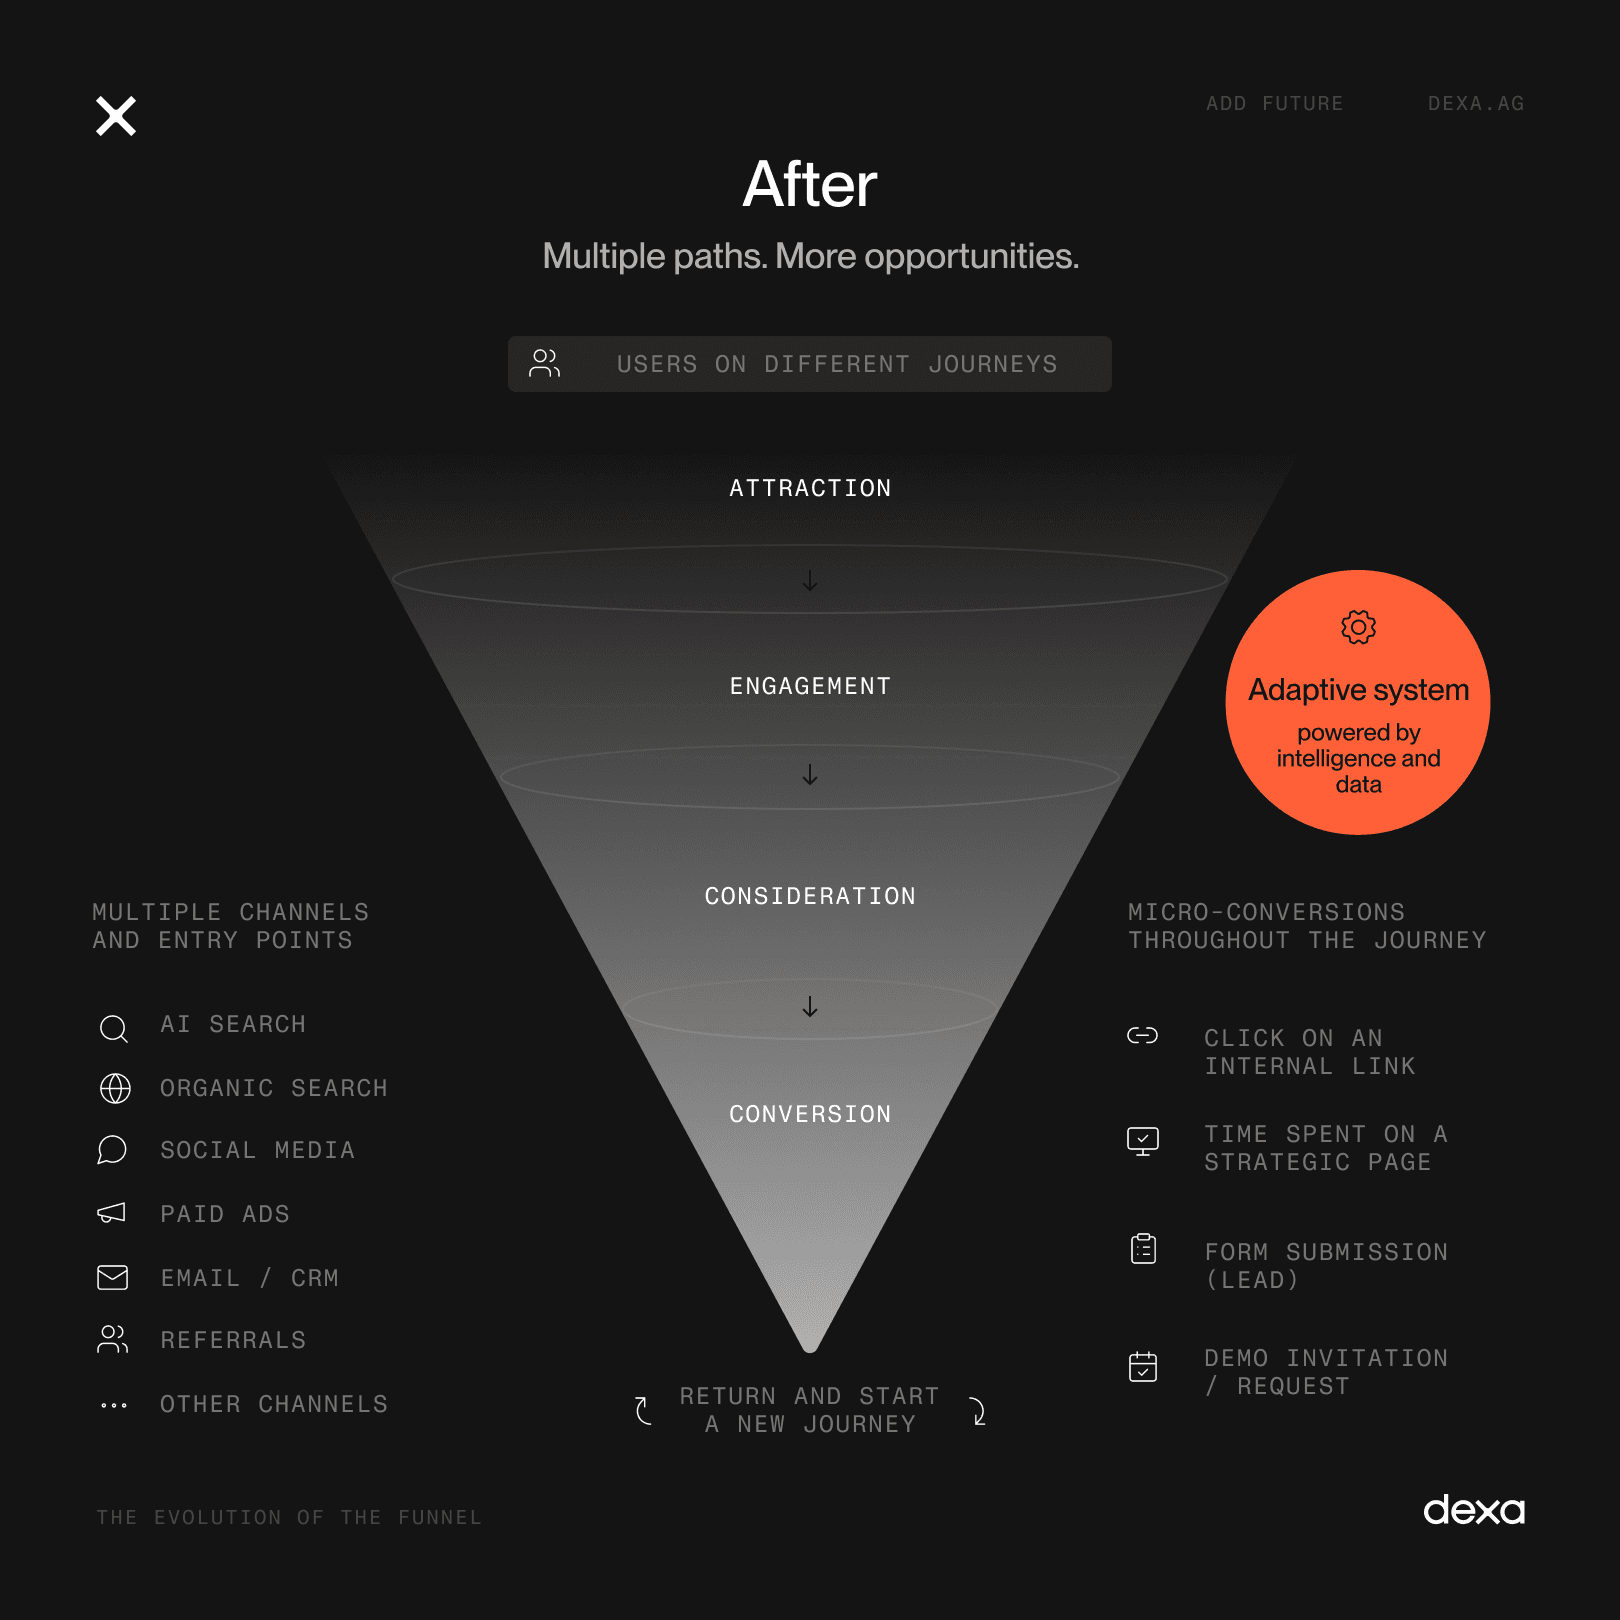
Between a visitor's first anonymous touchpoint and the signing of a contract, there is a series of micro-conversions: clicking an internal link, staying on a strategic page, filling out a form, or accepting an invitation to a demo. The conversion funnel is the analytical model that maps this journey, measuring the rate at which users move forward (or drop off) at each stage.
Converting, then, does not mean simply closing a sale. A conversion is any predefined event of value in your analytics plan, from downloading an in-depth resource to requesting a business proposal.
The Evolution of the Funnel
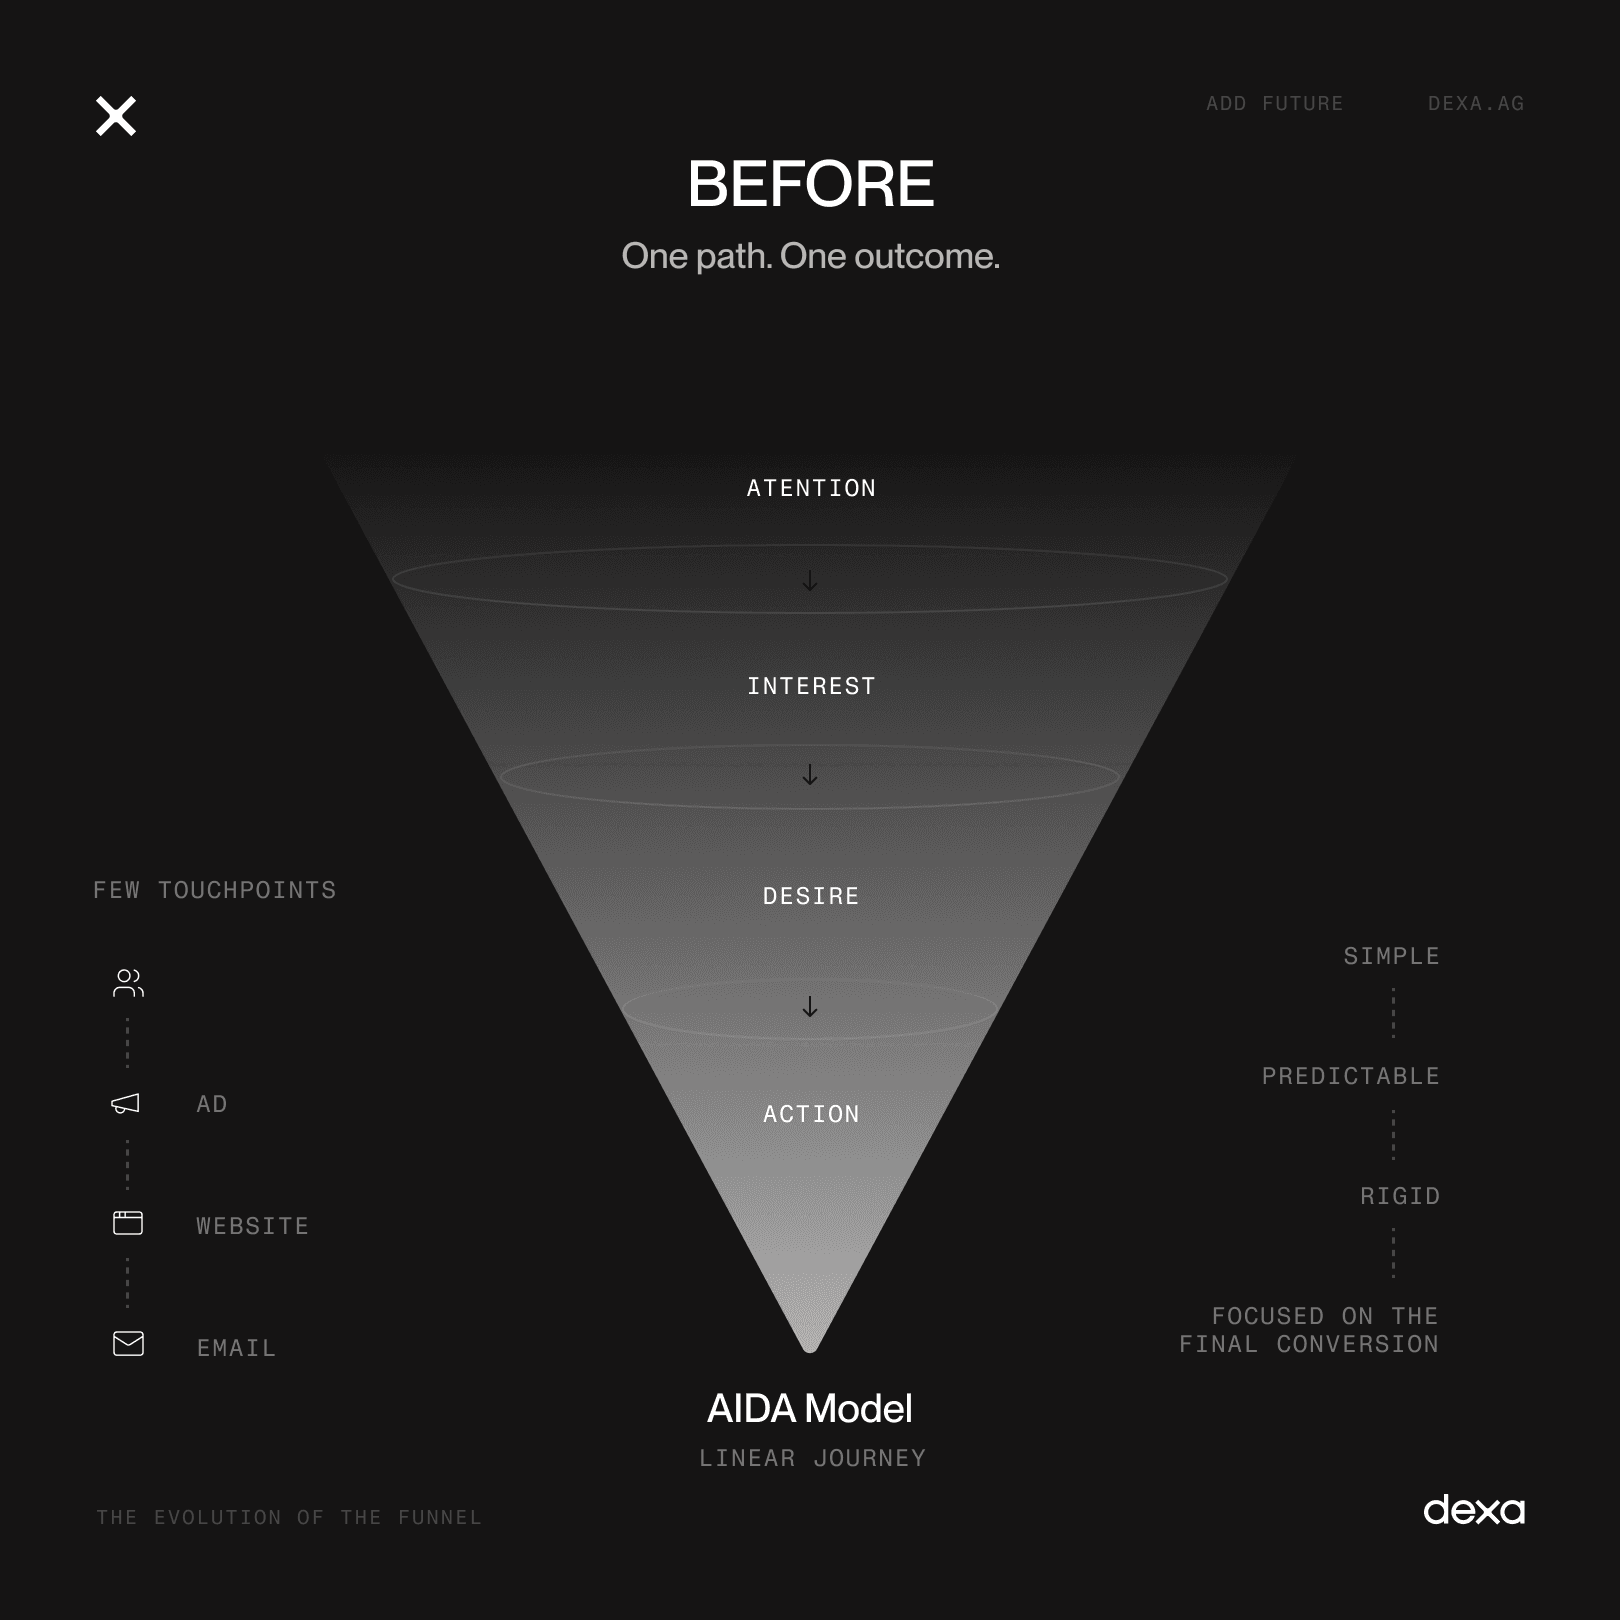
The idea of the funnel began as an entirely linear path, the classic AIDA model (Attention, Interest, Desire, and Action). However, modern buyer behavior has changed.
Today's journey is not a straight line but a dynamic flow: users come in, leave, search on AI-powered search engines, consume recommendations across multiple channels, and return at different points in the journey.
The Stages of the Conversion Funnel
The stages of the funnel help classify the type and intensity of the intent a user shows in each interaction. An informational search, reading a case study, and requesting a proposal represent different contexts and should not, therefore, receive the same treatment.
Top, middle, and bottom function as bands of intent, not mandatory steps. A user can enter through the middle, go straight to the bottom, return to more informational content, or move between different touchpoints before converting. What defines the stage is the behavior observed at that moment, not the chronological order of the journey.
Stage | What characterizes this moment | How to measure it |
Top of funnel (TOFU) | The audience identifies a need, learns about a topic, or makes first contact with the brand. It is common to research, consume content, and explore different pages. | Qualified visits, engagement, browsing depth, and micro-conversions |
Middle of funnel (MOFU) | The problem becomes clearer and research goes deeper. The user looks for technical information, case studies, approaches, and alternative solutions. | Conversion to lead, return visits, access to strategic pages, and qualification |
Bottom of funnel (BOFU) | Commercial intent becomes more evident. Factors such as vendor, fit, risk, investment, and delivery capacity enter the evaluation. | Qualified leads, contact requests, demos, opportunities, and proposals |
Closing and post-sale | The decision has already been made, and the experience now shapes adoption, retention, expansion, and referrals. | Revenue, retention, expansion, churn, and referrals |
This classification should also not depend solely on content format. A case study, for example, usually supports the comparison between vendors, but it can also be someone's first contact with the company. Similarly, a service page can receive both a user ready to request a proposal and someone still trying to understand how a particular solution works.
This is why identifying the stage requires looking at the context of the interaction. Traffic source, search performed, pages visited, return visits, micro-conversions, and sales actions all help reveal which intent is being expressed at that moment.
This means that TOFU is not synonymous with first contact, MOFU is not a mandatory second stage, and BOFU does not necessarily correspond to the last page visited before conversion. A user can discover the company through a case study, visit a service page, come back days later for a technical article, and only then request a proposal.
The AIDA model can complement this reading by organizing communication into four movements: attention, interest, desire, and action. It is useful for structuring messages and stimuli. The funnel, in turn, helps analyze volumes, behaviors, and conversions across different levels of intent. Neither should be interpreted as a literal reproduction of each user's individual journey.
How to Calculate the Conversion Rate
Saying a site converts at 5% still leaves a question open: 5% of which audience, for which action? The rate only guides a decision when the numerator and denominator belong to the same stage of the funnel. The basic formula is:
Conversion rate (%) = number of conversions ÷ total number of people eligible to convert × 100
The denominator needs to match the stage being analyzed. To measure visitors who became leads, use the number of visitors. To measure leads who became opportunities, use the leads that could have advanced. Dividing all conversions by total traffic hides where the loss actually occurred.
Consider a period with 10,000 visitors, 500 leads, 75 opportunities, and 15 new customers. The visitor-to-lead conversion was 5%. Lead-to-opportunity was 15%. Opportunity-to-customer was 20%. Cumulative visitor-to-customer conversion was 0.15%. Each number answers a different question.
How to Measure Conversion Funnel Performance
A conversion rate can rise while business results get worse. This happens when volume grows without quality, when qualification criteria change, or when marketing and sales measure different stages of the same process.
This is why tracking how many people move through the funnel is not enough. The analysis needs to bring together four dimensions: progression, quality, value generated, and time to conversion.
In a nonlinear journey, this reading becomes even more important. A user might arrive through a service page, come back through an article, convert on a form, and only enter the sales pipeline weeks later. Measurement needs to account for both the intent shown and the contribution of the different touchpoints.
Which Indicators to Track at Each Stage
Top of funnel: qualified users and sessions, share by channel, organic queries, engagement rate, browsing depth, and visitor-to-lead conversion. Here, the focus should not be volume alone. A thousand loosely related visits can generate less value than 300 visits from an audience close to the ICP.
Middle of funnel: lead-to-MQL conversion (marketing qualified) and MQL-to-SQL conversion (sales qualified). This also includes return visits, engagement with strategic pages, interaction with case studies, lead scoring, and nurturing time. The goal is to identify whether interest is generating concrete signals of commercial intent.
Bottom of funnel: opportunities, win rate, sales cycle length, average deal size, CAC, and attributed or assisted revenue. A channel can generate fewer leads and still be more efficient if it delivers larger, more qualified opportunities with shorter cycles.
Post-sale: activation, retention, expansion, repeat purchases, churn, and customer value over the course of the relationship. In recurring-revenue models or long-term contracts, funnel efficiency also depends on the ability to retain and grow revenue after acquisition.
Marketing, Analytics, and Sales Need to Measure the Same Thing
Indicators only work when there is a shared definition of events. Lead, MQL, SQL, opportunity, proposal, and sale need to mean the same thing in analytics, in marketing automation, and in the CRM.
If the CRM classifies every form submission as an opportunity, but the sales team only considers something an opportunity when it has the right profile, an identified need, and an active project, the dashboard may show a healthy conversion rate while the pipeline stays weak.
Every stage of the funnel needs objective criteria, a defined data source, and owners responsible for validation. Without this standardization, comparing periods, channels, or campaigns means comparing different methodologies, not necessarily different performance.
The more useful question, then, is not simply "what is the conversion rate?" It is understanding which interactions are generating real progress, qualified opportunities, and revenue for the business.
How to Optimize the Top of the Funnel
When the top brings in a lot of visits and little progress, the common reaction is to tweak the CTA. Before doing that, it is worth checking who is arriving and what was promised. A broad message can drive up clicks while dragging down the quality of everything that follows.
Break down conversion by channel and landing page: organic traffic, paid media, referral, social, email, and direct access arrive with different expectations.
Align the promise with the content: the headline seen in search or in an ad needs to match what the page actually delivers.
Create next steps proportional to intent: a guide can lead to a diagnostic; a service page can lead to a sales conversation.
Reduce technical friction: performance, visual stability, accessibility, and mobile experience affect how long visitors stay and whether they act.
Test clear hypotheses: CTA, hierarchy, value proposition, and forms should be tested one at a time and tied to a specific metric.
Bounce rate, or its closest equivalent in GA4 based on engagement rate, helps investigate misalignment, but should not be read in isolation. A person can arrive, find a complete answer, and leave satisfied. The problem shows up when the exit combines low engagement, commercial intent, and the absence of the expected next step.
How to Optimize the Middle of the Funnel
The middle tends to accumulate leads who downloaded a resource but never showed buying intent. The bottleneck appears when nurturing turns into automatic blasts and qualification turns into counting clicks. Here, content needs to help the lead compare approaches and decide whether it is worth moving forward.
Organize content by question and maturity level: guides, comparisons, webinars, case studies, and solution pages each play a different role.
Use automation with context: the cadence should respond to the content consumed and the problem shown, not just the time elapsed since sign-up.
Use progressive qualification: collect only what is necessary at first, and enrich the profile as the relationship develops.
Review lead scoring: combine fit with the ideal profile with intent signals, such as return visits, pages viewed, and contact requests.
Define the handoff moment: marketing and sales need to agree on what qualifies as MQL, SQL, and opportunity.
Lead scoring should not reward click or download volume alone. A student can consume ten pieces of content without any buying potential. Meanwhile, a director who visits a service page and a case study can show strong intent with very few interactions. Profile and behavior need to be read together.
How to Optimize the Bottom of the Funnel
A lead who requests a proposal has already made it through most of the journey, but can still back out because of doubts left by the site or the sales process. At this stage, outreach needs to be fast and take into account what the person has researched. Shallow content, a generic proposal, and a lack of evidence all raise perceived risk.
Give sales the context they need: source, pages visited, converted content, company, role, and stated need all make outreach more relevant.
Address real objections: case studies, methodology, scope, integrations, security, and implementation criteria support complex decisions.
Reduce response time: high-intent leads should reach the CRM with an owner, a priority, and a deadline already assigned.
Analyze losses by reason: price, timeline, poor fit, priority, and competition each call for a different response.
Track the full cycle: the channel that generates the most form submissions may not be the one that generates the most revenue or the best win rate.
Why the B2B Funnel Requires a Different Reading
In B2B sales, it is rare for a single person to travel the entire path. A specialist identifies the solution, leadership validates the impact, the procurement team negotiates, and legal assesses risk. Whoever signs the contract may never even use the platform. The funnel needs to reflect this movement between roles, interests, and criteria.
This makes progression less linear. A lead might arrive through a technical article, come back through a branded search, share a case study internally, and only then request a proposal. Last-click attribution reduces this path to a single point and tends to undervalue content that educated the buyer or gave them confidence in the decision.
Frameworks like BANT and SPIN Selling can support qualification and the sales conversation. BANT checks elements such as budget, authority, need, and timeline. SPIN organizes questions around situation, problem, implication, and need-payoff. Neither one replaces understanding the journey or the quality of the data marketing collects.
In a B2B lead generation strategy, the most important indicator is rarely the total number of contacts. The most useful set combines qualified leads, opportunities created, win rate, deal size, CAC, and time to close by source.
How Traffic Source Changes the Funnel
A click on an ad following a direct offer and a visit from a comparative search can land on the same landing page. Even so, they arrive with different expectations and different levels of maturity. Comparing the two sessions as if they were equivalent distorts the rate. The source reveals the promise that brought the person in and helps estimate how far they are from a decision.
Source | Entry pattern | What to analyze |
Organic search | The person expresses a question, a problem, or an intent to find a solution | Query, landing page, branded vs. non-branded, assisted conversion, and lead quality |
Paid media | Targeting and messaging create a direct route to an offer | Match between ad and page, cost per lead, qualification, CAC, and saturation |
AI and referrals | An answer, recommendation, or third-party content may have already covered part of the research | Referral source, landing page, source question on the form, and sales quality |
Direct | The user arrives with no identifiable referrer in analytics | Untagged campaigns, return visits, branded search, and attribution limitations |
Google Analytics describes source and medium as dimensions used to identify where traffic comes from and how it arrives. This classification needs to follow the lead all the way to the CRM. Without that connection, marketing knows the clicks and sales knows the contracts, but no one can measure the full path.
Direct traffic also calls for caution. In GA4, direct / none represents visits with no clear referrer, not necessarily people who typed the site's address. Links without UTM parameters, apps, documents, and tracking limitations can all inflate this group.
Lead Volume Is Not Funnel Quality
Consider two channels. Channel A generates 10,000 visits, converts 4% into leads, and qualifies 10% of them. The result is 40 qualified leads. Channel B generates 6,000 visits, converts 3% into leads, and qualifies 30%. Despite less traffic and a lower initial conversion rate, it delivers 54 qualified leads.
If the analysis stops at form submission, Channel A will look superior. Once the funnel accounts for quality and commercial progress, Channel B produces more value. This is why conversions should be calculated by source, with the analysis carried through to opportunity, sale, and revenue.
How Marketing Strategies Help Optimize the Conversion Funnel
Marketing works at different points in the journey to attract better-fit audiences, reduce friction, sustain interest, and improve the quality of the opportunities generated. In a nonlinear funnel, these strategies complement one another. As outlined in Dexa's approach to building a digital marketing strategy, SEO can qualify the entry point, paid media can accelerate acquisition, content can support decisions, the CRM can sustain the relationship, and CRO can remove barriers to conversion.
SEO, GEO, and AEO Qualify the Entry Point
Funnel quality begins before the user even reaches the site. When search, content, and the offer are misaligned, a company can generate traffic without generating real business intent. SEO, GEO, and AEO work precisely on this connection between discovery, context, and answer.
SEO: increases the visibility of relevant pages in search engines and connects content to the intent behind each search.
AEO: structures clear, direct answers for engines that deliver responses straight to the user.
GEO: strengthens the brand's presence and verifiability in generative search answers and experiences.
These strategies help bring in users who are a better match for what the company offers. Information architecture, intent coverage, trustworthy content, and a solid technical experience also make it easier to move between articles, case studies, service pages, and other conversion points.
Paid Media Accelerates Acquisition and Re-Engagement
Google Ads, social media, and remarketing make it possible to reach specific audiences faster. Efficiency, however, depends on the alignment between targeting, messaging, intent, and landing page.
More leads do not necessarily mean a better funnel. Beyond cost per lead, it is worth tracking qualification, CAC, opportunities, and revenue generated by each campaign to understand which investments actually contribute to the business.
Content Supports Consideration and Decision
Content also plays a role after discovery. Case studies, comparisons, research, webinars, technical articles, and service pages help answer questions, reduce objections, and give people evaluating alternatives the arguments they need.
This is especially relevant in B2B journeys. A single piece of content can be accessed at different moments by different decision-makers. Strategy should therefore cover questions and decision criteria, rather than simply producing one asset for each fixed stage of the funnel.
CRM and Automation Keep the Journey Active
Not every contact is ready to talk to sales. CRM, email, and automation make it possible to sustain the relationship across different interactions, distributing content, re-engaging contacts, and identifying new signals of interest.
Segmentation and lead scoring also help prioritize whoever shows the strongest fit. In long sales cycles, this continuity keeps opportunities generated by other channels from getting lost between one visit and the next.
CRO and UX Reduce Friction in Conversion
CRO and UX come into play when there is interest but some barrier is making it harder to act. Long forms, confusing navigation, unclear CTAs, slow pages, or a lack of trust can interrupt a conversion that was already close.
Optimization should prioritize quality, not just volume. Simplifying a form, for example, can increase the number of leads while reducing the ability to qualify them. The best outcome is one that improves the experience without compromising the value generated for the business.
Distribution Expands the Entry Points
Social media, newsletters, communities, partnerships, and other distribution channels expand the paths through which a person can find and rediscover the brand.
This logic reinforces the nonlinear nature of the funnel. A user might discover the company on LinkedIn, search for the brand on Google, view a case study, and convert days later through direct access. This is why optimizing the funnel depends on the integration between channels, data, and messaging, not on the isolated performance of a single strategy.
Explore Dexa's Digital Growth services.
How Dexa Works Across the Full Cycle
When acquisition, content, and experience are evaluated separately, a site can gain traffic while sales receives weak leads. Dexa treats this misalignment as a single problem spanning acquisition, experience, and conversion.
The analysis brings together data from analytics, search, media, and the CRM to locate losses and pockets of value. It then evaluates architecture, content, value proposition, UX, technology, and measurement on priority pages.
Opportunities go into a single backlog: technical fixes, new content, connections between pages, campaigns, interface changes, or better integration between marketing and sales. Priority combines impact, evidence, effort, and the ability to measure results.
Want to find out where your funnel is losing opportunities?
Dexa connects SEO, GEO, AEO, UX, technology, and CRO to diagnose the full journey and prioritize improvements with measurable impact.